Linear Absolute Value Functions & Graphical Attributes
概要
動画投稿日|2014年8月16日
動画の長さ|35:38
What is the Absolute Value at 1:09
Defining Linear Absolute Value Function at 7:14
Graphing a Linear Absolute Value Function with a T-table at 14:42
Identifying the Graphical Attributes at 22:01
(Intervals of Increasing and Decreasing, Absolute Maximum or Minimum, Domain, Range)
Last Example at 29:04
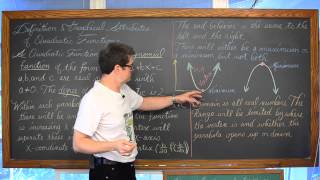
Defining Quadratic Functions & their Graphical Attributes
https://www.youtube.com/watch?v=VcI_jXaBHXc
Check out http://www.ProfRobBob.com, there you will find my lessons organized by class/subject and then by topics within each class. Find free review test, useful notes and more at http://www.mathplane.com
関連動画
30:57
Defining Quadratic Functions & their Graphical AttributesProfRobBob

25:30
Absolute Value Equations & Inequalities and the Number LineProfRobBob

36:54
Graphing Absolute Value Functions with Transformations 6 ExamplesProfRobBob
28:46
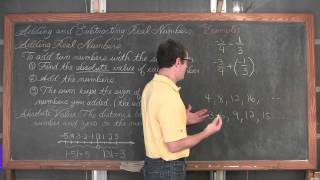
Adding and Subtracting Fraction Integers Real NumbersProfRobBob

25:41
Extrema Intro: Extrema on an Interval, Absolute Extrema on Closed Interval Calculus 1 ABProfRobBob
関連用語