Defining Quadratic Functions & their Graphical Attributes
概要
動画投稿日|2014年8月14日
動画の長さ|30:57
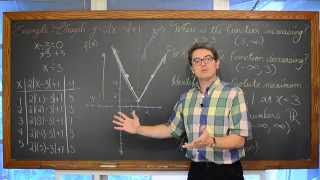
In this lesson I define Quadratic Functions in the form of y=ax^2+bx+c, identify the vertex, and graph a parabola using a t-table. I also discuss the definition of a Polynomial and Degree. We then identify Increasing and Decreasing Intervals, Domain and Range, End Behavior, and Absolute Maximum and Absolute Minimum
Graphing a Parabola with a t-table at 14:40
Identifying Graphical Attributes at 24:56
Some of my other lessons involving Parabolas
Graphing Parabolas in Standard Form
https://www.youtube.com/watch?v=icfex6aaWVk
Graphing Parabolas w/ Vertex & Intercepts
https://www.youtube.com/watch?v=eFZOnAcuVLM
Parabola Applications Maximizing Minimizing Reflectors, etc
https://www.youtube.com/watch?v=ka2DpW7A9iQ
Applications of Parabolas in Standard Form
https://www.youtube.com/watch?v=tZbrlvcd94E
Optimization Calculus Problems Minimizing Lengths
https://www.youtube.com/watch?v=tDoW2euBcfk
Negative Exponents and Power of Zero
https://www.youtube.com/watch?v=Coy_n9cA3iE
Check out www.ProfRobBob.com, there you will find my lessons organized by class/subject and then by topics within each class. Find free review test, useful notes and more at http://www.mathplane.com
関連動画
35:38
Linear Absolute Value Functions & Graphical AttributesProfRobBob

25:41
Extrema Intro: Extrema on an Interval, Absolute Extrema on Closed Interval Calculus 1 ABProfRobBob
6:25
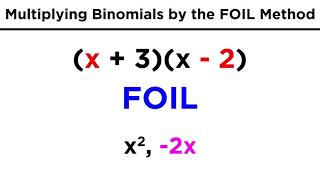
Multiplying Binomials by the FOIL MethodProfessor Dave Explains
5:32
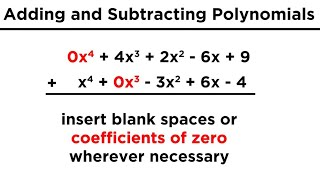
Adding and Subtracting PolynomialsProfessor Dave Explains

5:13
Introduction to PolynomialsProfessor Dave Explains
関連用語