Charts Are Like Pasta - Data Visualization Part 1: Crash Course Statistics #5
概要
動画投稿日|2018年2月21日
動画の長さ|10:22
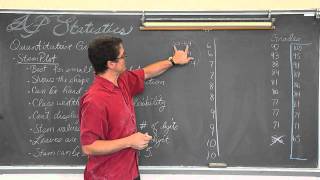
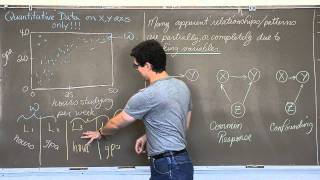
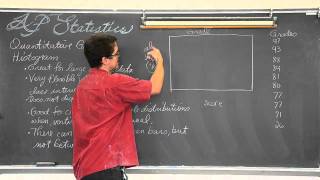
Today we're going to start our two-part unit on data visualization. Up to this point we've discussed raw data - which are just numbers - but usually it's much more useful to represent this information with charts and graphs. There are two types of data we encounter, categorical and quantitative data, and they likewise require different types of visualizations. Today we'll focus on bar charts, pie charts, pictographs, and histograms and show you what they can and cannot tell us about their underlying data as well as some of the ways they can be misused to misinform.
Crash Course is on Patreon! You can support us directly by signing up at http://www.patreon.com/crashcourse
Thanks to the following Patrons for their generous monthly contributions that help keep Crash Course free for everyone forever:
Mark Brouwer, Nickie Miskell Jr., Jessica Wode, Eric Prestemon, Kathrin Benoit, Tom Trval, Jason Saslow, Nathan Taylor, Divonne Holmes à Court, Brian Thomas Gossett, Khaled El Shalakany, Indika Siriwardena, Robert Kunz, SR Foxley, Sam Ferguson, Yasenia Cruz, Daniel Baulig, Eric Koslow, Caleb Weeks, Tim Curwick, Evren Türkmenoğlu, Alexander Tamas, Justin Zingsheim, D.A. Noe, Shawn Arnold, mark austin, Ruth Perez, Malcolm Callis, Ken Penttinen, Advait Shinde, Cody Carpenter, Annamaria Herrera, William McGraw, Bader AlGhamdi, Vaso, Melissa Briski, Joey Quek, Andrei Krishkevich, Rachel Bright, Alex S, Mayumi Maeda, Kathy & Tim Philip, Montather, Jirat, Eric Kitchen, Moritz Schmidt, Ian Dundore, Chris Peters, Sandra Aft, Steve Marshall
--
Want to find Crash Course elsewhere on the internet?
Facebook - http://www.facebook.com/YouTubeCrashCourse
Twitter - http://www.twitter.com/TheCrashCourse
Tumblr - http://thecrashcourse.tumblr.com
Support Crash Course on Patreon: http://patreon.com/crashcourse
CC Kids: http://www.youtube.com/crashcoursekids
関連動画


関連用語