Scatter Plot Intro and Lurking Variables defined
概要
動画投稿日|2011年9月14日
動画の長さ|14:25
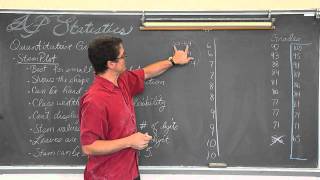
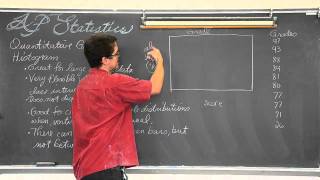
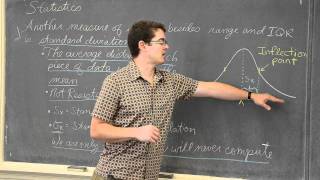
I introduce the structure of scatterplots and explain what characteristics you will need to use to intrepret them. I discuss how lurking variables can help to form the patterns that we see. I also go over the two type of outliers we may see in scatterplots.
Check out http://www.ProfRobBob.com, there you will find my lessons organized by class/subject and then by topics within each class. Find free review test, useful notes and more at http://www.mathplane.com If you'd like to make a donation to support my efforts look for the "Tip the Teacher" button on my channel's homepage www.YouTube.com/Profrobbob
関連動画


関連用語