2 Proportions Pooled Hypothesis z-test & Confidence Intervals
概要
動画投稿日|2012年2月2日
動画の長さ|31:21
I introduce how to compare 2 sample proportions through the use of z-tests and confidence intervals. I finish with a 2 Sample Pooled z-test. EXAMPLES AT 11:09 21:28
I have added annotations to improve some of the language of my example.
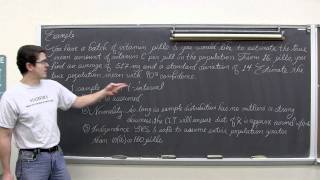
Defining the variables
Pm: Population proportion of men snacking
Pw: Population proportion of women snacking
Conditions:
SRS is stated
Since 380(.608)=231.04, 380(1-.608)=148.96, 370(.53)=196.1, 370(1-.53)=173.9 are all greater than or equal to 5 the sampling distribution of the difference of sample proportions will be approximately Normal.
Independence: It is reasonable to assume each population of men and women are greater than ten times each sample size 10(380)=3800 and 10(370)=3700.
Conclusion: The observed difference of .078 or 7.8% or one more extreme has a p value of .03 which is less than our level of significance of .05 so we reject Ho. There is not enough evidence to conclude there is a difference in the snacking habits of men and women.
Check out http://www.ProfRobBob.com, there you will find my lessons organized by class/subject and then by topics within each class. Find free review test, useful notes and more at http://www.mathplane.com If you'd like to make a donation to support my efforts look for the "Tip the Teacher" button on my channel's homepage www.YouTube.com/Profrobbob
関連動画


関連用語