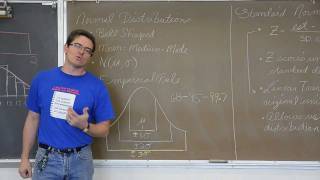
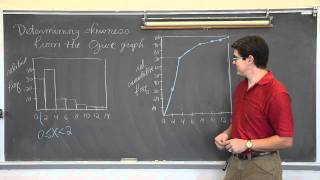
Distribution Shapes, Ogive Graphs, and Time Plots
概要
動画投稿日|2011年9月7日
動画の長さ|14:58
A review of the shapes of distributions and the relationships between the three measures of center. Also included is an intro to the Ogive graph and Time Plots.
Check out http://www.ProfRobBob.com, there you will find my lessons organized by class/subject and then by topics within each class. Find free review test, useful notes and more at http://www.mathplane.com If you'd like to make a donation to support my efforts look for the "Tip the Teacher" button on my channel's homepage www.YouTube.com/Profrobbob
関連動画

12:56
Describing Distributions in StatisticsProfRobBob

11:23
Mean, Median, and Mode: Measures of Central Tendency: Crash Course Statistics #3CrashCourse

13:17
Resistance, Mean, Median, 5 Number Summary and BoxPlotsProfRobBob
14:26
Density Curves, Empirical Rule & Normality, Z-score IntroProfRobBob
9:56
Determining Skewness In Ogive GraphsProfRobBob
関連用語