Linear Functions, their Attributes, & Interpreting Slope and y-Intercept
概要
動画投稿日|2014年7月30日
動画の長さ|34:59
I start off by giving the definition of a linear function, slope and y intercept.
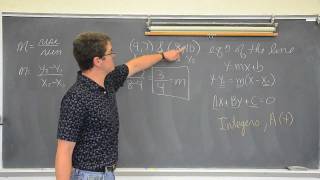
At 6:15 I work through two examples of finding slope from 2 points.
At 13:05 we look at a real world setting modeled by a linear regression line and interpret the meaning of the slope and the y intercept in this real life application.
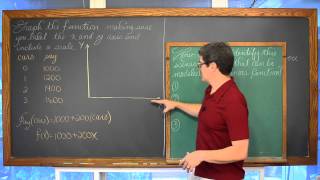
At 21:16 I graph the equation from the previous word problem using the slope and y-intercept and with the x-intercept and y-intercept. We then zoom in to the area of the graph that is appropriate to the word problem.
At 29:16 I discuss the attributes of linear graphs, like how can you identify if they will be increasing or decreasing, if there are any maximum or minimums, and horizontal and vertical lines.
Please check out my other lessons about Linear Functions:
Graphing Lines in Slope-Intercept form y=mx+b
https://www.youtube.com/watch?v=xyVJZKu7Euw
Graphing lines using X & Y Intercepts
https://www.youtube.com/watch?v=KtgddI4qIok
Standard Form of a Line
https://www.youtube.com/watch?v=sF7G0EMR_hw
Slope and Equations of Lines
https://www.youtube.com/watch?v=xf8-BEdoSss
Equations of Lines and Graphing
https://www.youtube.com/watch?v=Wmi1EysOHUQ
Equations of parallel and perpendicular lines
https://www.youtube.com/watch?v=ECljEiIgX_M
Regression Lines and Correlation with TI-84
https://www.youtube.com/watch?v=L_h7nqNqgPs
Check out www.ProfRobBob.com, there you will find my lessons organized by class/subject and then by topics within each class. Find free review test, useful notes and more at http://www.mathplane.com
関連動画
34:38
Modeling Word Problems with Linear Functions Part 1ProfRobBob

32:14
Modeling Real World Problems Linear Functions Part 2ProfRobBob

17:14
Graphing System of Linear InequalitiesProfRobBob
14:51
Rate of Change Slope & Point Slope Equation of LinesProfRobBob
6:56
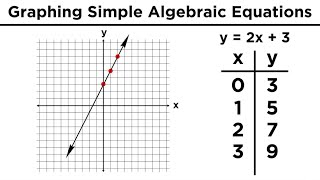
Graphing in Algebra: Ordered Pairs and the Coordinate PlaneProfessor Dave Explains
関連用語